TN MBBS Rank List 2026-27 — Score-wise & Community-wise Analysis
Last updated:
How many candidates hold every NEET mark in Tamil Nadu’s official Provisional Rank List for MBBS/BDS 2026-27, published by the Selection Committee (DME) on 10 August 2026 — broken down by quota and by community. Every number on this page is counted directly from the three published lists.
marks 705 → 177
marks 599 → 177
marks 693 → 177
the three lists
Every NEET mark from 705 down to 177 in all three lists — how many hold exactly that mark and how many hold that mark or better, per community — plus a type-a-mark lookup, the official 2026-27 seat matrix how deep the ranks actually went last year, and a full private-college report (community-wise government quota, plus management / minority / NRI). 13 sheets, 203 KB.
📊 Download .xlsxHow many candidates at each score band
The “total at/above” columns are what actually matter in counselling: that is how many people sit ahead of you in that list before the seats reach your band.
| NEET score band | Govt Quota | Govt — total at/above | 7.5% Govt School | Management Quota | Mgmt — total at/above |
|---|---|---|---|---|---|
| 700–720 | 2 | 2 | 0 | 0 | 0 |
| 650–699 | 119 | 121 | 0 | 31 | 31 |
| 600–649 | 607 | 728 | 0 | 156 | 187 |
| 550–599 | 1,840 | 2,568 | 25 | 646 | 833 |
| 500–549 | 3,798 | 6,366 | 158 | 1,681 | 2,514 |
| 450–499 | 5,117 | 11,483 | 485 | 2,989 | 5,503 |
| 400–449 | 5,481 | 16,964 | 693 | 3,857 | 9,360 |
| 350–399 | 5,202 | 22,166 | 679 | 4,270 | 13,630 |
| 300–349 | 4,972 | 27,138 | 607 | 4,573 | 18,203 |
| 250–299 | 3,823 | 30,961 | 396 | 4,040 | 22,243 |
| 200–249 | 3,567 | 34,528 | 408 | 3,486 | 25,729 |
| 177–199 | 1,398 | 35,926 | 174 | 1,227 | 26,956 |
| TOTAL | 35,926 | — | 3,625 | 26,956 | — |
Counted from the published lists. A candidate can appear in more than one list — the Government Quota and Management Quota lists overlap heavily, because most students apply for both.
Tell us your cutoff or NEET score and our counsellors call you back with the colleges you can actually get — community-wise, with the seats still vacant. Takes 30 seconds.
Community-wise totals — Govt Quota & 7.5%
Only the Government Quota and 7.5% Government School lists carry a community column. OC candidates are printed without a community rank — they are ranked on the general merit list only — so the OC figures below are counted from the community column itself, not from the rank column.
| Community | Govt Quota | % of list | 7.5% Govt School | % of list |
|---|---|---|---|---|
| OC | 1,272 | 3.54% | 18 | 0.50% |
| BC | 14,896 | 41.46% | 1,028 | 28.36% |
| BCM | 2,124 | 5.91% | 165 | 4.55% |
| MBC & DNC | 9,117 | 25.38% | 1,361 | 37.54% |
| SC | 7,080 | 19.71% | 788 | 21.74% |
| SCA | 1,095 | 3.05% | 212 | 5.85% |
| ST | 342 | 0.95% | 53 | 1.46% |
| TOTAL | 35,926 | 100% | 3,625 | 100% |
Government Quota — community × score band
This is the table to read if you want to know how crowded your own community is at your score level.
| Score band | OC | BC | BCM | MBC & DNC | SC | SCA | ST | TOTAL |
|---|---|---|---|---|---|---|---|---|
| 650–720 | 12 | 82 | 3 | 22 | 1 | 0 | 1 | 121 |
| 600–649 | 64 | 363 | 31 | 123 | 20 | 5 | 1 | 607 |
| 550–599 | 93 | 1,068 | 85 | 510 | 80 | 2 | 2 | 1,840 |
| 500–549 | 173 | 1,894 | 200 | 1,195 | 294 | 31 | 11 | 3,798 |
| 450–499 | 182 | 2,283 | 256 | 1,609 | 703 | 61 | 23 | 5,117 |
| 400–449 | 187 | 2,240 | 293 | 1,483 | 1,076 | 156 | 46 | 5,481 |
| 350–399 | 210 | 1,938 | 290 | 1,277 | 1,203 | 211 | 73 | 5,202 |
| 300–349 | 155 | 1,841 | 303 | 1,114 | 1,250 | 236 | 73 | 4,972 |
| 250–299 | 134 | 1,389 | 285 | 773 | 1,035 | 160 | 47 | 3,823 |
| 177–249 | 62 | 1,798 | 378 | 1,011 | 1,418 | 233 | 65 | 4,965 |
| TOTAL | 1,272 | 14,896 | 2,124 | 9,117 | 7,080 | 1,095 | 342 | 35,926 |
7.5% Government School — community × score band
The 7.5% list is small (3,625 candidates) and its topper scored 599, so a government-school student converts a given mark into a far better rank here than in the general list.
| Score band | OC | BC | BCM | MBC & DNC | SC | SCA | ST | TOTAL |
|---|---|---|---|---|---|---|---|---|
| 550–599 | 0 | 7 | 3 | 13 | 1 | 0 | 1 | 25 |
| 500–549 | 1 | 47 | 6 | 87 | 14 | 3 | 0 | 158 |
| 450–499 | 1 | 137 | 19 | 248 | 64 | 11 | 5 | 485 |
| 400–449 | 3 | 189 | 28 | 314 | 127 | 25 | 7 | 693 |
| 350–399 | 8 | 206 | 21 | 250 | 142 | 39 | 13 | 679 |
| 300–349 | 3 | 180 | 19 | 182 | 166 | 46 | 11 | 607 |
| 250–299 | 0 | 105 | 31 | 112 | 102 | 41 | 5 | 396 |
| 177–249 | 2 | 157 | 38 | 155 | 172 | 47 | 11 | 582 |
| TOTAL | 18 | 1,028 | 165 | 1,361 | 788 | 212 | 53 | 3,625 |
Management Quota — score-wise only
The Management Quota rank list is a single general merit list with no community column at all, because management quota seats carry no community reservation. 26,956 candidates, topper at 693 marks. Use the score-band table above for its distribution, or the score checker for an exact count at any mark.
Seat matrix 2026-27 — how many MBBS seats, and who fills them
The tentative seat matrix published as Annexure III of the Selection Committee’s 2026-27 prospectus. Government college seats, split by quota:
| List | Colleges | Sanctioned seats | All India Quota (15%) | ESIC ward quota | State Quota |
|---|---|---|---|---|---|
| Government medical colleges (MBBS) | 36 | 5,050 | 753 | 50 | 4,247 |
| ESIC, Chennai (MBBS) | 1 | 149 | 22 | 30 | 97 |
| Government dental colleges (BDS) | 3 | 250 | 37 | — | 213 |
Only the State Quota column is filled through Tamil Nadu counselling; the All India Quota 15% goes through MCC, and the ESIC ward quota is a separate pool for insured persons’ wards.
| Government medical college | Sanctioned | AIQ 15% | State Quota |
|---|---|---|---|
| Madras Medical College, Chennai | 250 | 38 | 212 |
| Stanley Medical College, Chennai | 250 | 37 | 213 |
| Madurai Medical College, Madurai | 250 | 38 | 212 |
| Thanjavur Medical College,Thanjavur | 150 | 23 | 127 |
| Kilpauk Medical College, Chennai | 150 | 22 | 128 |
| Chengalpattu Medical College, Chengalpattu | 100 | 15 | 85 |
| Tirunelveli Medical College,Tirunelveli | 250 | 37 | 213 |
| Coimbatore Medical College, Coimbatore | 200 | 30 | 170 |
| Mohan Kumaramangalam Medical College, Salem | 100 | 15 | 85 |
| K A P Viswanathan Government Medical College, Trichy | 150 | 23 | 127 |
| Thoothukudi Medical College, Thoothukudi | 150 | 22 | 128 |
| Kanyakumari Government Medical College, Asaripallam | 150 | 22 | 128 |
| Government Vellore Medical College, Vellore | 100 | 15 | 85 |
| Theni Government Medical College,Theni | 100 | 15 | 85 |
| Government Dharmapuri Medical College, Dharmapuri | 100 | 15 | 85 |
| Government Villupuram Medical College, Villupuram | 100 | 15 | 85 |
| Thiruvarur Govt. Medical College, Thiruvarur | 100 | 15 | 85 |
| Government Sivagangai Medical College, Sivaganga | 100 | 15 | 85 |
| Government Thiruvannamalai Medical College, Thiruvannamalai | 100 | 15 | 85 |
| Government Medical College, Omandurar,Chennai | 100 | 15 | 85 |
| Government Medical College & Esic Hospital, Coimbatore | 100 | 15 + 20 ward | 65 |
| Government Medical College, Pudukottai | 150 | 22 | 128 |
| Government Medical College, Karur | 150 | 23 | 127 |
| Government Erode Medical College & Hospital, Perundurai | 100 | 15 + 30 ward | 55 |
| Government Medical College And Hospital, Cuddalore | 150 | 22 | 128 |
| Govt.Ariyalur Medical College Hospital, Ariyalur | 150 | 22 | 128 |
| Govt. Dindigul Medical College Hospital, Dindigul | 150 | 22 | 128 |
| Govt.Kallakuruchi Medical College Hospital | 150 | 22 | 128 |
| Govt. Krishnagiri Medical College Hospital | 150 | 22 | 128 |
| Govt. Nagapattinam Medical College Hospital | 150 | 22 | 128 |
| Govt. Namakkal Medical College Hospital, Namakkal | 100 | 15 | 85 |
| Govt. The Nilgiris Medical College Hospital, The Nilgiris | 150 | 22 | 128 |
| Govt. Ramanathapuram Medical College Hospital | 100 | 15 | 85 |
| Govt. Thiruvallur Medical College Hospital | 100 | 15 | 85 |
| Govt. Tiruppur Medical College Hospital, Tiruppur | 100 | 15 | 85 |
| Govt. Medical College Hospital, Virudhunagar | 150 | 22 | 128 |
Tamil Nadu has not yet published a seat matrix for self-financing (private) medical colleges or for the state private universities for 2026-27 — neither prospectus carries that annexure. Their seat counts are therefore deliberately left blank here rather than estimated.
Up to which rank actually got a seat (2025)
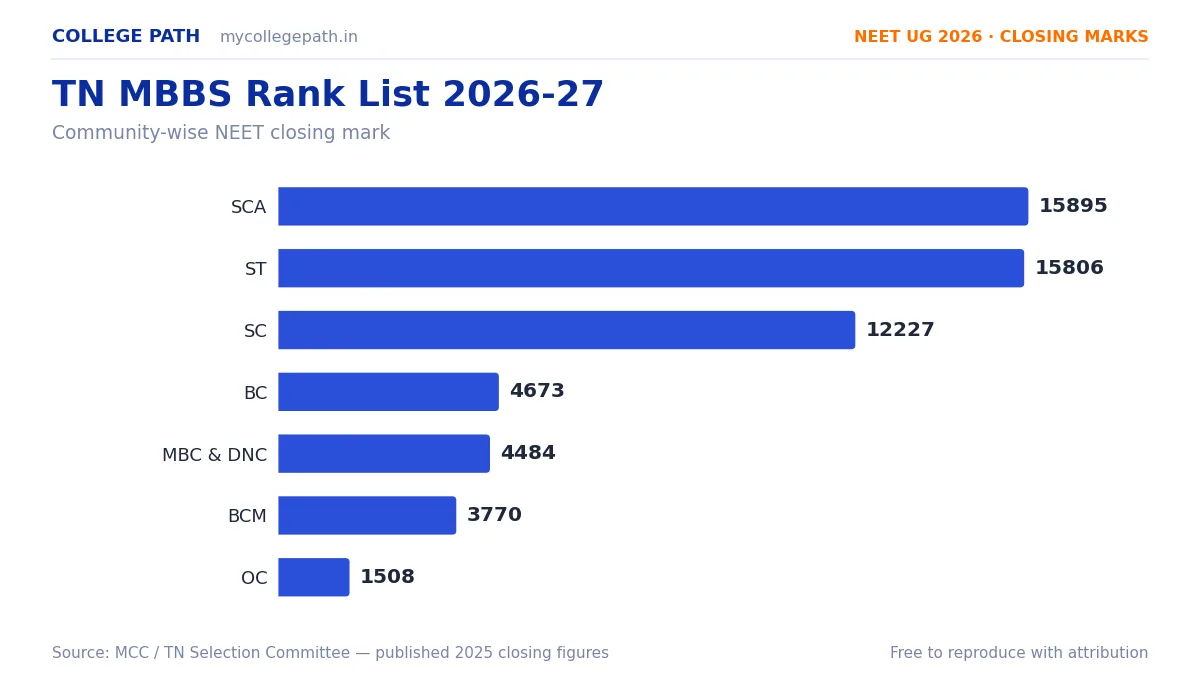
The deepest general state rank that actually received an MBBS seat in each pool, from the official 2025 allotment lists. This is what happened last year — it is not a prediction for 2026; cut-offs move with the seat matrix and with choice filling.
Government medical colleges
| Community | Round 1 | Round 2 | Round 3 |
|---|---|---|---|
| OC | 1,308 (538) | 1,454 (534) | 1,508 (533) |
| BC | 3,934 (500) | 4,244 (496) | 4,673 (492) |
| BCM | 3,598 (504) | 3,717 (502) | 3,770 (502) |
| MBC & DNC | 4,306 (496) | 4,417 (494) | 4,484 (494) |
| SC | 10,311 (441) | 10,584 (439) | 12,227 (426) |
| SCA | 15,834 (397) | 15,895 (396) | 15,895 (396) |
| ST | 15,196 (402) | 15,768 (397) | 15,806 (397) |
ESIC medical college
| Community | Round 1 | Round 2 | Round 3 |
|---|---|---|---|
| OC | 1,173 (541) | 1,173 (541) | 1,173 (541) |
| BC | 1,602 (532) | 1,693 (530) | 1,731 (529) |
| BCM | 1,824 (528) | 1,824 (528) | 1,824 (528) |
| MBC & DNC | 2,061 (524) | 2,100 (523) | 2,100 (523) |
| SC | 7,585 (464) | 7,585 (464) | 10,373 (441) |
| SCA | 11,112 (435) | 11,112 (435) | 11,112 (435) |
| ST | 15,352 (401) | 15,390 (400) | 15,390 (400) |
Self-financing (private) colleges
| Community | Round 1 | Round 2 | Round 3 |
|---|---|---|---|
| OC | 4,184 (497) | 4,439 (494) | 4,466 (494) |
| BC | 6,065 (478) | 6,326 (476) | 7,229 (467) |
| BCM | 6,730 (472) | 6,903 (470) | 7,299 (467) |
| MBC & DNC | 6,403 (475) | 6,612 (473) | 7,909 (461) |
| SC | 13,710 (414) | 14,009 (411) | 15,229 (402) |
| SCA | 19,202 (368) | 19,321 (367) | 21,072 (352) |
| ST | 18,431 (374) | 19,711 (364) | 19,714 (364) |
State private universities
| Community | Round 1 | Round 2 | Round 3 |
|---|---|---|---|
| OC | 6,048 (478) | 6,360 (475) | 7,185 (468) |
| BC | 6,338 (475) | 6,743 (472) | 8,501 (456) |
| BCM | 6,974 (470) | 7,119 (468) | 8,251 (458) |
| MBC & DNC | 6,894 (471) | 7,162 (468) | 8,992 (452) |
| SC | 14,403 (408) | 14,584 (407) | 16,455 (391) |
| SCA | 19,342 (367) | 20,848 (354) | 22,179 (343) |
| ST | 19,612 (365) | 19,948 (362) | 22,014 (344) |
Government-quota seats inside self-financing and private-university colleges are filled from the SAME government-quota merit list, which is why they appear here. Government Erode’s ESIC “IRT Ward” allotments are excluded — that is a separate pool, not a general-quota closing. The number in brackets is that rank’s NEET mark.
Enter your NEET score in the College Path app to see your real published rank — general and community — in all three lists, plus the colleges that rank actually reaches.
🔍 Open the Rank CheckerHow these numbers were counted
- Source: the three official PDFs titled “Provisional Rank List for MBBS/BDS 2026-27 Session” published by the Selection Committee, Directorate of Medical Education & Research, Chennai on 10 August 2026.
- Every row of all three lists was read — 66,507 entries in total. Rank sequences run unbroken from 1 to the list size with no gaps or duplicates, so nothing is missing or double-counted.
- Only counts are published here. No candidate names, application numbers or roll numbers are reproduced.
- These are provisional lists. If the Selection Committee issues an addendum after grievance redressal, the totals will shift slightly.
Related: TN MBBS closing marks by college · NEET UG 2026 counselling schedule · State quota vs All India Quota
College-wise closing marks
This page counts candidates by score. To see the actual closing mark for a specific college, use the college-wise cutoff index — round-wise closing marks and ranks by community for all 93 Tamil Nadu medical and dental colleges.